Wednesday, December 5, 2012

Indian direct investment abroad


My article with this title appeared in the Dec 8 2012 issue of the Economic & Political Weekly as a commentary. It is reproduced below. The article has been quoted in the India blog of New York Times here


A considerable part of the discussion on economic policy in India is devoted to foreign investment in Indian equity and debt securities. The reverse flow of capital from India into foreign equity and debt, though equally important for this discussion, attracts far less attention in the financial media and is the subject of this paper.

A rapid rise in the flow of Indian investments abroad was noted early on by Nagraj (2006). Nayyar (2008) extensively analysed investment by Indian firms in the context of international investment from developing countries using all available data. Both these studies used data up till 2006; since then, India’s investments abroad have grown manifold as we will see later.

More recently, Chalapati Rao and Dhar (2011) have examined direct investments from India in a critique of the policy regime governing cross-border direct investment flows. They look at the sector wise composition of investments, derived from recently available RBI data, as well as at individual cases to understand why Indian business houses are investing abroad.

A major concern of this paper is with the official investment data. The RBI provides a confusing array of data sets[1] relating to outward investments. This paper begins by looking for clues in RBI’s regulations and accounting practices to reconcile the different data sets. It goes on to uncover some of the key features of the outward investments and concludes by examining the shortcomings in the regulatory environment which allow the end use of investments to remain mostly opaque.

RBI’s accounting practices

The Reserve Bank of India (RBI) regulates cross-border investment in securities and is the primary repository of data on investment by Indian entities abroad. Following International Monetary Fund standards, RBI presents Indian investment abroad involving equity and debt securities (other than those held by the RBI as reserve assets) under two heads - ‘direct investment’ and ‘portfolio investment’ (RBI, 2010).

While ‘direct investment’, carries the usual connotation of being investment made with the objective of obtaining a “lasting interest and control” in a foreign enterprise, the key characteristic of ‘portfolio investment’ is considered its “negotiability”, facilitating ready withdrawal of investment by the investor.

RBI regulations[2] permit various Indian entities including companies, mutual funds, and individuals to invest in equity and debt of foreign entities. Each entity has multiple avenues for making overseas investments. Companies can set up or acquire Joint Ventures (JV) or Wholly Owned Subsidiaries (WOS) abroad and invest in them. They can also invest in the securities of unrelated foreign companies (neither JV nor WOS). Individuals can invest in the equity of companies directly as well acquire a portfolio through the medium of mutual funds. The question under consideration is how RBI categorizes different investors and the different avenues of investment abroad as ‘direct’ or ‘portfolio’ investment.

The RBI Balance of Payments Manual (RBI 2010) documents “current practices” in compiling Balance of Payments statistics. According to the manual[3], the main component of ‘direct investment’ is the investment by Indian entities in equity and debt of JV companies or WOS. Another component is the investment by banks in their branches abroad. Investments by mutual funds and investment by Indian companies in equity and debt securities of unrelated foreign companies is considered ‘portfolio investment’. The manual is formally silent about the treatment of investments by individuals in foreign securities, but there are hints[4] that these are being included in ‘direct investment’ instead of ‘portfolio investment’ where they should belong.

However, what has been described above is only “current practice”. Going back in time, reveals other practices. Companies were permitted to invest directly in non-related foreign entities that had a minimum of 10% holding in a listed Indian company, from Jan 2003[5]; such investments were opened up to Mutual funds and even individual investors and all these investments were considered ‘direct investments’.[6] The condition restricting this form of investment to companies with 10% Indian holding was dropped, first for mutual funds in July 2006[7] and then for companies in Sept 2007[8]. However, Foreign Exchange Management Regulation of Dec 2007[9] still called such investments ‘direct investment’.

RBI documentation down to the present[10] continues to shirk from providing sharp distinctions between ‘portfolio investment’ and ‘direct investment’, an indication that there have been no strong reasons from a policy perspective for RBI to distinguish between the two[11].

With this background, we proceed to look at the different data sets from RBI on investments abroad[12].

The disinterest in portfolio investment

Cross-border investments are available in two periodic statements of the RBI – the Balance of Payments (BOP) and the International Investment Position (InIP). The BOP statement reveals the movement of capital over a period while the InIP statement shows the stock of international financial assets and liabilities, held as direct and portfolio investment, at the end of a period.[13]

Table 1 contains select data from InIP statements showing the stock of India’s ‘direct investment’ and ‘portfolio investment’ abroad. India’s investment abroad is overwhelmingly in the form of direct investment and is growing rapidly. The remainder of this paper will be confined to a discussion of direct investment.

Cross-border flows of direct investment

Table 2 shows the net yearly flow of direct investments out of and into India (columns A and D respectively). Heightened flows are observed in both directions from 2006-07. Data from the table shows that net Indian direct investment abroad in the last six years is just over 50% of the net FDI that has come into India. Interestingly, the percentage is the same if the comparison is extended to the last decade.

A closer look at the components of direct investment provides additional insights. Following IMF standards, direct investment flows reported by RBI include flows into equity and debt as well as reinvested earnings[16]. Columns B and E in Table 2 show the reinvested earnings of Indian investment abroad and FDI in India respectively. While the reinvested earnings of foreign capital show a steady increase over the years, the reinvested earnings of Indian capital abroad have remained constant from 2005-06 in a period when the stock of  investment increased over 10 times (see Table 1). RBI figures of reinvested earnings of Indian companies seem doubtful[17].

A useful comparison between direct investment flowing abroad and FDI flowing into India is from the point of view of how they affect the balance of payments. In such a comparison, reinvested earnings must be excluded from the flows as they do not affect the balance of payments[18]. Figure 1 shows the yearly flow of Indian direct investments abroad and FDI in India after excluding reinvested earnings in both cases.

 Intriguingly, as the figure shows, outflows have moved more or less in tandem with FDI inflows between 2002-03 and 2009-10. Net annual outflows rose sharply between 2004-05 and 2006-07 to plateau at higher levels, with the exception of a sharp dip[19] in 2011-12. In 2010-11, from a balance of payments perspective, more direct investment went out of India than came into India! Again, from the same perspective, the net outflow in the last six years is nearly 65% of the net inflow, showing the extent to which the contribution of FDI to shoring up India’s balance of payments is negated by outward investments.

Another point of interest is the performance of India’s direct investments abroad in terms of the return on investment. Unfortunately, the data available publicly is rather limited in extent and quality. There are two components to the returns – earnings reinvested abroad and dividend and profits repatriated. The unreliable nature of the estimates of the earnings reinvested abroad has already been pointed out. The data on dividend and profits is available only up till 2008-09[20]. It shows maximum yearly dividend and profits of under $ 0.5 billion on an investment stock that amounted to nearly $ 50 billion by the start of 2008-09. The announcement of a 50% reduction in the tax rate on dividends from investments in joint ventures and subsidiaries abroad in the last budget[21] is an indirect admission by the government that dividend repatriation is below expectations.

Disaggregating direct investments

As has been noted earlier, RBI data on Indian direct investment abroad aggregates several categories of investments including investments by Indian entities in Joint Ventures (JV) and Wholly Owned Subsidiaries (WOS). More recently, RBI has started making another data set publicly available - the outward investment flow into JV/WOS abroad as reported by authorized dealers[22].
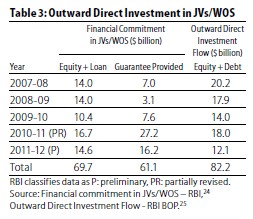
The financial commitments of Indian entities towards their JV/WOS abroad are in the form of equity, loans and guarantees. The equity and loan components together constitute the outward investment flow into JV/WOS. The guarantees (backed by assets in India), provided to obtain financing abroad, do not entail an immediate flow of funds. Table 3 shows these components of the financial commitment in JV/WOS. It also contains the outward direct investment in equity and debt reported in the BOP[23] statements for comparison.


The cumulative investment into JV/WOS abroad by Indian entities in the last five years has been to the tune of nearly $70 billion, while the cumulative direct investment is a little over $82 billion. Investment in JV/WOS forms the most part – nearly 85% - of outward direct investment.

However, a substantial amount - $12 billion spread over five years - is being invested elsewhere (unless RBI data on JV/WOS investments is somehow incomplete). This would include investment of banks in their branches abroad and investments by individuals. One hopes that in the interest of greater transparency, RBI will also provide details of these investments in future.

Table 3 reveals another important feature of the financial commitments in JV/WOS abroad, namely the large guarantee component, pointing to the highly leveraged nature of acquisitions by Indian companies. The financial commitment made in the form of guarantees is about 47% of total financial commitments made in the last 5 years. Guarantees have been rarely invoked in the past[26]. However, with the strong possibility of acquired companies failing to perform in a deteriorating economic environment, mounting guarantees pose heightened risks to Indian banks backing the guarantees made by companies.   

An important attribute of the RBI data is that it allows the identification of investing entities by name and provides the amounts they have invested. An analysis of the data for the last five years (July 2007 – June 2011) reveals[27] that just over 380 companies have invested over $10 million each and account for over 82% of the investments flowing abroad in the last five years.

Grouping the companies by business conglomerates shows the ten largest outward investor groups to be Tata, Bharti Airtel, Essar, Gammon, Reliance, Religare, Suzlon, Reliance – ADAG, Vedanta and United Phosphorous in that order. These groups, through their 35 odd companies, account for more than a third of the investment outflows for this period. Just five of these groups – Tata, Bharti Airtel, Reliance, Reliance-ADAG, and Suzlon account for over half of the total guarantees extended for this period.

The opaqueness of investments in foreign ventures

The main drawback of the RBI data on JV/WOS is that it identifies only the immediate recipient of the investment. These by and large turn out to be intermediaries - shell companies that do not have any operations; few Indian companies directly invest in the company that is the actual target of their investment.

There is a marked preference for locating these intermediaries in Singapore, Mauritius, and Netherlands - countries that provide an attractive ‘tax neutral’ regime for holding companies. These have been the top three investment destinations for Indian investors’, together accounting for over 55% of the outward investment in the period April 2008 to Feb 2012.[28]

The distancing of the foreign target from the Indian investor is often through multiple layers of shell companies. Multi-tiered intermediate structures located across several countries are justified as necessary to exploit tax treaties between different countries to the most advantage. With RBI regulations not insisting on full disclosure of how investments are routed to the target companies[29], these complex structures make it difficult to identify the actual destination of the investments and its end use, unless the investors volunteer this information.

With a liberal policy regime in place, companies can generally make investments without seeking prior approval, within generous limits[30]. Combined with a weak regulatory environment, this leaves enough room for investment from India to be channeled into areas prohibited by regulation, such as real estate and banking, or else be ‘round tripped’. ‘Round tripping’ allows investors to hide their identity and avoid taxes by taking the investment out of India and bringing it back under the cloak of foreign investment.

The opportunity for tax arbitrage arises from the differential tax treatment meted out by India to foreign investors from certain countries in comparison to Indian investors. Mauritius and Singapore are popular staging points for investing in India. India’s tax treaties with these countries allows investors coming through intermediaries based there to avoid paying taxes on capital gains made in India.

The existence of ‘round-tripping’ is periodically confirmed by media reports on investigations into suspect cases[31]. The RBI is aware of the problems with the policy on direct investments abroad and it appears that these have been transmitted to the government[32]. The government, however, has chosen to maintain the status quo.

Concluding remarks

Export of capital by Indian companies rose dramatically in tandem with FDI and measures up to a sizeable fraction of the FDI inflows over the last six years. While there is a keen debate on the public interest in allowing or limiting FDI, it is surprising given its scale, that there is no such engagement with Indian direct investment abroad.

The government justifies the public interest in this policy by repeating the ‘textbook’ benefits – the markets that will open up for Indian goods and services increasing exports and employment, the technology and skills infusion that will take place, or the energy resources that will be secured for India’s benefit.

It is difficult to evaluate if any of these benefits indeed accrue to India, given the absence of even basic data on the end use of investments, leave alone metrics designed to measure the efficacy of policy. What is clear from the enthusiasm with which India’s business conglomerates export capital is that the policy certainly works in their interest.

References:

Chalapathi Rao, KS and B Dhar (2011): “Formulating India’s FDI Policy: Waiting for Godot” in Alternate Survey Group, Indian Political Economy Association (ed) Economic Growth & Development in India: Deepening Divergence (New Delhi: Yuva Samvad Prakashan)
Khan, HR (2012): “Outward Indian FDI - Recent trends and emerging issues” in RBI Monthly Bulletin, April 2012, (http://www.rbi.org.in/scripts/BS_ViewBulletin.aspx) last accessed on 8 Aug 2012
Nagaraj, R (2006): “Indian Investments Abroad”, Economic & Political Weekly, Vol - XLI No. 46, November 18, 2006
Nayyar, Deepak (2008): “The Internationalization of Firms From India: Investment, Mergers and Acquisitions”, Oxford Development Studies, Taylor and Francis Journals, vol. 36(1), pages 111-131
RBI (2010): Balance of payments manual for India (Mumbai: RBI), (http://www.rbi.org.in/Scripts/PublicationsView.aspx?Id=13013) last accessed on 7 Aug 2012

Notes:


[1] RBI puts out data on outward investment from India as part of the Balance of Payments statement and in monthly press releases on “Overseas Direct Investment”. RBI also occasionally publishes articles on Indian direct investment abroad in its monthly bulletins. For a recent example of the latter, see Table 1 in Khan (2012).
[2] The latest regulations are available in RBI’s “Master Circular on Direct Investment by Residents in Joint Venture (JV)/ Wholly Owned Subsidiary (WOS) Abroad, July 02, 2012” (http://www.rbi.org.in/scripts/BS_ViewMasCirculardetails.aspx?id=7352), last accessed on 7 Aug 2012.
[3] See sections 5.59 to 5.61 and 5.68 of RBI (2010).
[4] See section 6.20 of RBI (2010) - “On the issue of survey on outward portfolio investments ....  transactions of high net-worth individuals are not being included.” See also the comments at the end of Table 1 in the article “Indian Investment Abroad in Joint Ventures and Wholly Owned Subsidiaries: 2009-10 (April-March)” in the RBI monthly bulletin of July 2010.
[5] RBI circular “A.P. (DIR Series) Circular No.66 dated Jan 13, 2003” (http://www.rbi.org.in/scripts/NotificationUser.aspx?Id=1038&Mode=0), last accessed on 8 Aug 2012
[6] RBI regulation “Foreign Exchange Management (Transfer or Issue of any Foreign Security) (Second Amendment) Regulations, 2003” (http://rbi.org.in/Scripts/BS_FemaNotifications.aspx?Id=1300) last accessed on 8 Aug 2012.
[7] RBI circular “A.P. (DIR Series) Circular No. 3 dated July 26, 2006” (http://www.rbi.org.in/Scripts/NotificationUser.aspx?Id=3028&Mode=0), last accessed on 8 Aug 2012
[8] RBI circular A. P. (DIR Series) Circular No.11 dated Sept 26, 2007(http://www.rbi.org.in/Scripts/NotificationUser.aspx?Id=3833&Mode=0), last accessed on 8 Aug 2012
[9] RBI Regulation “Foreign Exchange Management (Transfer or Issue of any Foreign Security) (Third Amendment) Regulations, 2007” (http://rbi.org.in/Scripts/BS_FemaNotifications.aspx?Id=4652) read along with “Foreign Exchange Management (Transfer or Issue of Any Foreign Security) (Amendment) Regulations, 2004” (http://rbi.org.in/Scripts/BS_FemaNotifications.aspx?Id=2126) last accessed on Aug 8 2012
[10] In the latest available regulations (referenced in note 2), Section B6.1(i) concerning “Portfolio investments by listed Indian companies” is a subsection of Section B titled “Direct Investment outside India”
[11] This is in line with the assertion made by Chalapati Rao and Dhar (2011:111) that regulations for investing abroad have been primarily designed to “move towards full capital account convertibility”
[12] The dataset in Khan (2012: Table 1) on outflows in respect of outward FDI has not been considered in this paper as it does not come with any explanation of how it can be reconciled with BOP data.
[13] See section 2.3 of RBI (2010) for the differences between BOP and InIP data.
[14] RBI puts out InIP data in press releases every quarter. The data up to Mar 2012 is available at (http://www.rbi.org.in/scripts/BS_PressReleaseDisplay.aspx?prid=26761), last accessed on 8 Aug 2012
[15] BOP statement is included in the Reserve Bank of India Bulletin issued every month, available at the RBI website (http://www.rbi.org.in)
[16] Earnings from pre-existing direct investment may be reinvested in the enterprise or paid out as dividend.
[17] Poor data has been attributed in the past to RBI’s data collection through a “Survey of India’s Foreign Liabilities and Assets” to which it was not mandatory for companies to respond. The author is unaware of the current practice.  
[18] Reinvested earnings of FDI in India appear as a credit entry under the ‘foreign direct investment’ head of the ‘capital account’ of the BOP and as a debit entry under the ‘investment income’ head of the ‘current account’. Reinvested do not affect the balance of payments. Indian investment abroad is similarly treated.
[19] There is some inconsistency in RBI data that could account in part for the sharp dip. This inconsistency is also seen in RBI’s figure on investments in joint ventures and subsidiaries (see Table 3) for 2011-12 which are higher than its BOP figure for the total direct investment outflow.
[20] See “Invisibles in India’s Balance of Payments: An Analysis of Trade in Services, Remittances and Income” Mar 10, 2010 available at http://www.rbi.org.in/scripts/BS_ViewBulletin.aspx?Id=11029 last accessed on 27 Sept 2012
[21] This tax concession has been noted by Khan (2012: para 43)
[22]  Data on Outward Direct Investment is published every month by the RBI and is available at (http://www.rbi.org.in/scripts/Data_Overseas_Investment.aspx), last accessed on 8 Aug 2012
[23] In this table, the outward direct investment abroad is the direct investment in equity and debt in that year and does not include reinvested earnings or the proceeds of disinvestment.
[24] See note 24
[25] For BOP data see note 17
[26] See table 1 in Khan(2012) for the guarantees invoked each year
[27] Analysis carried out by the author using outward direct investment flow data (note 24).
[28] Calculated from the data in table 4 of Khan (2012)
[29] The reporting requirements are specified in Appendix A of the ‘master circular’ detailed in note 2
[30] Exhibit 1 in Section E of Khan (2012) explains how the policy has been ‘relaxed’ in the last few years   
[31] See for example the PTI report “Mauritius funds into Indian stocks face Sebi, RBI probe” Times of India, July 22, 2012 (http://timesofindia.indiatimes.com/business/india-business/Mauritius-funds-into-Indian-stocks-face-Sebi-RBI-probe/articleshow/15090438.cms) accessed on Aug 8 2012

Tuesday, October 16, 2012

Book review of Communities, Commons & Corporations


Communities, Commons and Corporations

by Perspectives (New Delhi: Perspectives), 2012; pp 164,
Rs 100.

My review of this book appeared in the Oct 13, 2012 issue of the Economic & Political Weekly. The text is reproduced below.

Privatising the Commons

Several hundred million people across rural India depend on the commons – natural resources such as forests, pastureland, “wasteland”, coasts, lakes and rivers that are shared by the community – for their livelihoods. These livelihoods are under threat with the state handing over these resources at an accelerating pace to corporations for industrial or commercial use. How has it come to be that communities have no legal rights over the natural resources they have used for generations? How does the state justify privatising these commons? How are communities reacting to this challenge to their lives and livelihoods? These and related questions drive the subject matter of the book under review.

Communities, Commons and Corporations is authored by Perspectives, a group of students and teachers from Delhi’s universities. The group declares in its programme that its task is to “document the lives and struggles of people on the margins of law and society”. Perspectives has produced a few other works of such documentation in the past. Its earliest work, Abandoned: Development and Displacement,
dates to 2007 and has been reviewed in this weekly.

The methodology used for the present work is a combination of field visits – to “sites of change, conflict and crisis” to “understand issues and situations ‘firsthand, on the ground’” – and research based on secondary sources. The book begins with a detailed first person account of observations made during two field visits to communities who largely depend on natural resources over which they have no property rights
– a forest community in Harda, Madhya Pradesh and a fishing community in coastal Kutch, Gujarat. This is followed by essays on the enclosure of the commons and the consequent displacement of communities in colonial and present day India. The latter part of the book critically analyses the laws and policies that govern the appropriation of the commons today and interrogates the economic development that is taking place.

What Are the ‘Commons’?

Bringing clarity to the notion of the “commons” is crucial for a work of this nature. Perspectives explains that the “commons”, in its view, are natural resources customarily used by communities over generations to support their livelihood. Forests populated by tribal communities, coasts, coastal waters and lakes used by fisher folk, and pastureland and rivers sustaining villages are all part of the commons. The use rights of a community over some part of the commons may or may not be recognised by the state. Even where it recognises community use rights, the state considers itself to be the owner of the resource with the right to change the pattern of its use anytime. An example of the latter are the gauchar (grazing) lands in Kutch
that Perspectives finds are vested with the panchayats, though legal ownership is with the state.

Any defence of communities living off the commons requires one to counter the view propagated by the administration, and often accepted uncritically, that these communities are “encroaching on public property”. There is a need to explain how these communities have come to be without rights over resources crucial to their survival in a world dominated by private property. Perspectives examines colonial history to provide an
answer along these lines.

Who Is the ‘Encroacher’?

Commercial interest – the sole objective of maximising revenue – informed the colonial attitude to different communities and natural resources. Settled agriculture was encouraged, for revenue could be collected from land under cultivation. The needs of efficient collection – making individuals responsible for revenue and forcing mortgage or sale of their land for recovery of dues, among others – led the colonial state to
institutionalise private ownership of cultivated land and maintain the record of ownership.

On the other hand, nomadic and semi nomadic livelihoods that depended largely on forests and pastures were discouraged, for they were difficult to tax and yielded little revenue. Ignoring the legal rights of forest, fishing and pastoral communities deriving from custom and tradition, the colonial state assumed ownership of all land and other natural resources except land under cultivation from which it derived revenue.

Forests were exploited for revenue through commercial forestry after restricting the use rights of forest communities. Village commons were made to yield revenue by bringing them under cultivation. The legal regime established by the colonial state divided natural resources neatly into “privately owned” and “state owned”. It had no place for community ownership or management of resources.

Moving to the present, Perspectives notes that the injustices meted out to communities dependent on forests and other commons in colonial times were never reversed. The continuation of institutions like the forest department, laws governing land acquisition, and forests and policies towards “wasteland” from colonial times reflects the continuity in the outlook of the contemporary Indian state towards people dependent
on the commons.

This outlook comes to the fore wherever resistance is offered by a community to appropriation by the state.
While reading this book, this reviewer came across another instance of the forcible eviction of a community from the commons. The community in question was of traditional fisher folk who had been living in floating huts on the large Loktak Lake in Manipur for generations. The state chief minister reportedly termed them “encroachers” and justified their eviction as necessary for the “development” of the lake.

The Geography of Privatisation


While there has been continuity in the way the State views communities using the commons from colonial times to the present, the pattern of appropriation has changed in keeping with the changes in the economy.

In the colonial period, the state assumed legal ownership of the commons. Communities were however allowed its use as long as this did not come in the way of the State deriving revenue, wherever such possibility existed. Republican India saw large scale enclosure of the commons and displacement of people by large dams and other industrial projects promoted by the state. The last two decades have seen a major change in the pattern of appropriation, with the commons now being transferred to private corporations.

Corporations, Perspectives observes, pose a threat to communities dependent on the commons in two ways (p 86):

“by directly appropriating the land, water and forests on which they are dependent or by polluting these resources in a manner that their capacity to generate livelihoods is diminished or exhausted.”

Perspectives draws attention to certain geographical areas where the privatization of the commons is taking place at a rapid rate.

In the Himalayan states – Himachal Pradesh, Uttarakhand, Arunachal Pradesh and Sikkim – where the availability of agricultural land is low making forests and pastures extremely important for livelihood, dozens of ‘run-of-the-river’ hydro projects are coming up on the principal rivers.

The mineral rich areas of central and eastern India – encompassing the states of Odisha, Chattisgarh and Jharkhand, and parts of Madhya Pradesh, Andhra Pradesh and West Bengal are densely forested and home to a large tribal population. Today, there is a major push to open new mines and coal blocks under the most pristine forests have already been allocated to various corporations. Scores of thermal power plants are also under construction in these states, clustered near coal reserves and water sources.

A third geography that is being privatized rapidly is India’s 8000 km long coastline, dotted with fishing villages and salt farming communities. Numerous private ports and port based Special Economic Zones, refineries, thermal power plants and petrochemical industries are coming up along the coast. It is not just the competitive advantage of locating industry dependent on physical imports near the coast that is attracting corporations. Perspectives points out that land is cheaper and easier to acquire on the coast as fishing communities do not possess ownership rights over the land they use.

These are of course not the only regions or causes figuring in the take over of the commons. Most cases of land acquisition across the country involve some common land. Perspectives cites the example of the POSCO steel plant which requires 4004 acres of land, of which only 438 acres are privately owned. The government land, most of it classified as ‘forest’ land, has been used for betel vine cultivation by local villagers for generations.

The impotency of law

There are laws to protect the commons such as the Environment Protection Act (EPA). Then there are laws of fairly recent origin aimed at recognizing the rights of traditional users of the commons such as the Forest Rights Act (FRA). How do these laws measure up against their stated purpose?

Any impact on the environment is clearly of great concern to communities surviving on the commons, affecting as it often does, larger numbers than the enclosure of the commons itself. The EPA requires an Environment Impact Assessment as a precondition for most projects. The EIA process is considered the mainstay of the state’s effort to protect the environment. In a detailed assessment of the EIA process, Perspectives points to its many flaws including the most basic, the hollowness of the high sounding ‘public consultation’. The public affected by a project can at best voice its opinion at a ‘public hearing’ but has no powers to stop the project or even to set preconditions.

An excellent essay that forms the opening chapter of the book details the struggle for livelihood of Harda villagers and assesses the impact of measures such as the Joint Forest Management initiative and the Forest Rights Act. Perspectives finds that Joint Forest Management – a two decade old policy initiative, intended to get the cooperation of forest dwellers in achieving forest department objectives while at the same time providing avenues for them to improve their income – has not brought any positive change to the forest communities. The distribution of land titles under the FRA has barely progressed, with a paltry 3000 pattas issued to forest dwellers (tribal and non-tribal included) in Harda district, two years into the program, when just the tribal population of the district numbers 1.2 lakhs.

Why have the FRA and the JFM policy failed to bring any improvement to the ground situation of the forest dwellers? Perspectives rightly locates these failures in the highly asymmetric power structure that exists in the forest areas. The forest department has been responsible for guarding the forests from ‘encroachment’ for a hundred and fifty years, and in the process, accumulated immense powers over the forest dwellers. It will obviously resist any dilution of its powers – as will happen if forest dwellers are granted rights over forest land. The blatant abuse of power by the Forest Department and the Police in districts such as Harda has attracted the attention of the Supreme Court which recently ordered the state to set up a district level grievance redressal authority.

Perspectives concludes that legislations and policies will not prevent the appropriation of the commons and dispossession of the people under the current dispensation. “They will either be circumvented, or violated, or poorly implemented, or will actively facilitate this dispossession” (p 96)

The last portion of the book interrogates ‘growth’ and critiques the current pattern of development. It argues that economic growth today is strongly linked to the handover of natural resources to corporations. The ability of this type of development to generate secure jobs is questionable; however it is certainly leading to large scale destruction of traditional occupations and existing livelihoods. It concludes that this growth is not just ‘non-inclusive’, but actually comes at the cost of the most disadvantaged sections, creating poverty and worsening inequality.

Right at the beginning, Perspectives states that it has been written this book primarily for other students. The style adopted is in keeping with such an audience - direct, assertive and impassioned at times. Observations and experiences from field visits are woven in to add weight to arguments and some very incisive analysis. The book could have done with some tighter editing and a better presentation of data. However, these minor failings do not take away from its intrinsic value. ‘Communities, Commons and Corporations’ is an honest telling of a story that needs to be told.


(Copies of the book can be obtained from Sharmin Khodaiji, c/o D-1, Staff Quarters, Hindu College, Delhi University, Delhi 110007)


Thursday, January 19, 2012

Subsidies for the rich or subsidies for the poor?

Taxes account for over 84% of the combined revenue of the Union and State governments. How does India compare with other countries as far as tax revenues are concerned? What is the tax base of direct taxes? What percentage of their profits do companies actually pay in taxes? These questions are examined in the context of the anticipated large fiscal deficit by the Union government in 2011-12 and the plans to cut down on food, fuel and fertilizer subsidies in this InfoChange India piece.

Sunday, December 4, 2011

Unraveling India's oil subsidies

India Together carried this piece with the title 'Oil subsidy is all gas'. It is reproduced below with pointers to sources for all the data used and references to claims made.

The government periodically puts out data on the quantum of ‘under-recoveries’ by the public sector refiners and distributors of petroleum products – Indian Oil (IOCL), Bharat Petroleum (BPCL) and Hindustan Petroleum (HPCL) – on the sale of diesel, kerosene, and LPG. The exercise is calculated to prepare public opinion to accept higher prices. Mainstream media often uncritically reports the ‘under-recoveries’ as the 'loss' (see this ET report, for example) suffered by these oil marketing companies (OMC) or as the ‘subsidy’ that must be provided by the government to make up the loss. Such an interpretation, though natural, turns out to be quite off the mark.

'Under-recovery' is not the loss


The government measures ‘under-recovery’ as the loss an OMC would make if it imported a petroleum product, say diesel, from the international market and after paying ocean freight, import charges and customs duty and incurring inland transport and marketing costs, sold the product to a dealer at the government specified price. (Government note explaining under-recovery calculation)

It is a notional loss, for it is unrelated to the actual process by which oil companies make diesel available in the Indian market - by refining imported and domestic crude in Indian refineries. It is also an exaggerated loss.( The use of the 'under-recovery' concept to determine petroleum prices has been challenged recently in the Kerala High Court)

Price differentials in the international market between a refined product and crude oil reflect the product specific demand-supply equation rather than the inherent cost of producing the product. Shortage of refining capacity for a particular product – real or artificially created – pushes the differential up.

International price differentials over crude ($/bbl)

2010-11
2009-10
Petrol
  7-8
7-9
Diesel
14-15
7-9
Jet-kero
14-15
8-9

The table above (compiled by taking Singapore & Europe prices as listed in Page 21 of the Reliance annual report for 2010-11) shows the price differentials for petroleum products between 2009-10 and 2010-11. In 2009-10, petrol, diesel, and jet-kero (used to benchmark kerosene in India) all carried similar price differentials. The next year saw a near doubling of the differentials for diesel and jet-kero reflecting the pressure on the refining capacity for these products.

[This differential has gone up even further this year. For the 2nd fortnight of Nov 2011, the average price of India's crude oil basket was $108.80/bbl. During this period, the reference price of Diesel was $130.24/bbl and that of Jet-kero $127.63. (All data from the Petroleum Pricing and Analysis Cell (PPAC) of the the petroleum ministry.) The price differentials for Diesel and Jet-kero were greater than $21 and $19 respectively. Why have the 'diesel cracks been strong' (in the language of the refiners) ? Demand staying over refining capacity in China is cited as a reason.]

India has adequate refining capacity to meet the demand on each product. In any case, there is no reason why Indian public sector refineries should be making higher margins on diesel (or kerosene) because of the shortage of refining capacity in China. In linking the cost of diesel or kerosene in the Indian market to the international price, the government’s ‘under-recovery’ calculation assumes a fat refining margin for these products. ‘Under-recoveries’ do not represent losses, just as the assumed refining margins do not represent costs.  

If ‘under-recovery’ is not the loss of the OMC’s, how much are they actually loosing and what is the extent of the ‘subsidy’ that the government has to extend to them? A look at last years (2010-11) consolidated results of the three companies provides some surprises. All three showed profits, paid income tax, and declared dividends. Government provided support to these companies under two heads – a fixed amount for each liter of Kerosene and cylinder of LPG sold, and a discretionary grant announced quarterly. The aggregate amount is presented in the table (Data is from the published financial results of the companies) as subsidy.


Excise and Subsidy 2010-11 (Rs crores)

IOC
BPCL
HPCL
Total
Excise
30861
12394
9743
52998
Subsidy
24282
10048
9727
44056


Each of the three oil companies paid more excise to the government than it received as subsidy. In effect, the government returned a portion of the taxes it collected on petroleum products from the OMC’s. ‘Subsidy’ considered in this light, appears to be a tax concession by another name, not very different from the ‘fiscal stimulus’ the government extends to an industrial sector when it is in trouble.

The OMC’s showed a large loss in the first half of 2011-12 and this tells its own story. We will return to this a little later.

Who benefits from Indian crude?

Leaving refining costs and taxes aside, the price of petroleum products is determined by the price of crude oil. Government’s economists would have us believe that this is completely outside its control.

The fact is that a significant quantity of crude oil is produced in India, sufficient to meet one third of the crude oil requirements of the public sector oil refiners for products for the Indian market. The public sector producers – ONGC, GAIL, and Oil India – account for nearly 75% of this oil, while the rest comes from Reliance, Cairn and other private producers. (Monthly production statistics put out by the Petroleum ministry) The locally produced crude could be priced to moderate petroleum product prices for the Indian consumer. Alternatively, revenues derived from local production could be used for this purpose. The government’s economic philosophy however dictates otherwise.   

Private oil producers get rights to oil fields after signing production-sharing contracts with the government. These contracts mandate selling oil to Indian refiners at no less than the prevailing international prices. The contracts are structured such that government’s share of production will increase if the producers get a higher price for the oil. While providing the government with another source of revenue, these contracts, by locking Indian oil produce to international prices, ensure that the Indian public does not enjoy the benefits of local production.

The government treats the public sector oil producers somewhat differently, based on historical imperatives. They must sell their oil at a ‘discount’ to international prices to the public sector refiners. The ‘discount’, however, is not tied to the rise in international prices or the windfall profits made when this happens; it is fixed every quarter, at the government’s discretion.

The 2011-12 first half results of the OMC’s provide insights into how the government uses its discretion on ‘subsidies’ and ‘discounts’.

The oil companies together showed second quarter (Q2) losses of about 14000 crores, on the backs of first quarter (Q1) losses of about 9000 crores (Data from the quarterly published results). The government delayed announcing the Q2 ‘subsidy’, which, had it been timely, would have allowed the OMC’s to show a small profit for the quarter instead of a large loss. The Q1 ‘subsidy’ announcement was not followed up with cash, forcing the OMC’s to borrow from banks and pay high interest to finance crude oil imports. The public sector oil producers provided sharply lower ‘discounts’ to the OMC’s on crude oil price in Q2 compared to Q1 and showed sharply higher profits. One is left with the strong suspicion that these moves were orchestrated to make a strong case for increasing retail petroleum prices as well as to make government’s planned disinvestment in ONGC and OIL more attractive.

Taxing the aam admi

The central government has several revenue streams from petroleum products collected at different stages of processing.  At the crude oil stage, it collects royalty, a share of the production (from private producers), and excise on oil produced and customs duty on the oil imported. At the refining stage, it collects excise on the refined products such as diesel and petrol. Oil producers, refiners and marketers also contribute to the central exchequer by way of taxes on their profits, dividends and tax on the dividends. State governments collect royalty on crude oil and sales tax on petroleum products. Sales tax rates range from 18% - 25% on diesel and 19% - 33% on petrol with a few exceptions.

Last year, the central government’s income from the public sector oil and gas producers, refiners and marketers alone was in excess of Rs 100,000 crores, eclipsing the ‘subsidy’ it provided. State governments were not far behind, collecting over Rs 80,000 crores. (Estimates are based on figures for ONGC, MRPL, OIL, IOC, HPCL, NRL, and BPCL obtained from their annual reports)


Taxes on petroleum products add to the cost of all goods and services and reflect in their prices. Far from subsidizing the public, governments raised a substantial part of their revenue from the aam admi by taxing petroleum.