Saturday, December 29, 2012

The Price of Electricity in Delhi

My article with this title appears in the Jan 5, 2013 issue of the Economic & Political Weekly as a commentary. It is reproduced below.

A more recent piece also in EPW is available here

The price of electricity has gone up between 51% and 63% for different classes of consumers in Delhi, all in the space of one year. The highest increase of 63% has ironically been imposed on the consumers who consume the least – less than 200 units of electricity per month[1]. Table 1 shows the last three revisions of the energy tariff for domestic consumers. In addition to these charges, customers pay electricity tax and a fixed connection charge.

Table 1: Electricity tariff in Delhi for domestic consumption


Slab wise energy charges (Rs/unit)
Power price adjustment surcharge (%)
Deficit Surcharge (%)
Effective from
0-200 units
201-400 units
> 400 units


Mar-08
2.45
3.95
4.65


Sep-11
3.95
4.80
5.50
variable

Jul-12
4.65
5.70
6.50
variable
8%

Source: DERC tariff orders[2]

Electricity distribution in all of Delhi, with the exception of the New Delhi Municipal Council area and the cantonment, was privatized ten years ago and divided up between three distribution companies (discoms) – the Tata Power Delhi Distribution Ltd. (TPDDL) belonging to the Tata group, and BSES Rajdhani Power Ltd. (BRPL) and BSES Yamuna Power Ltd. (BYPL), both belonging to the Reliance ADAG group. The Delhi Electricity Regulatory Commission (DERC) fixes the tariff that can be collected by these entities. It will useful to recall the process followed in fixing tariffs before looking into the reasons for the large hikes in quick succession.

The Electricity Act, 2003, tasks the state electricity regulator with laying out the principles for tariff fixing ensuring “safeguarding of consumers' interest and at the same time, recovery of the cost of electricity in a reasonable manner”[3]. In Delhi, these principles find expression in DERC’s Multi Year Tariff (MYT) regulations for discoms.

Under these regulations, distribution companies submit a multi-year plan stating their annual revenue requirement including the cost of power, operation and maintenance expenses, depreciation, and a guaranteed return on capital employed. After review, and possible changes, the DERC approves the requirement for each utility and fixes a tariff structure that will enable all the utilities to meet their revenue requirements.

The actual performance of a utility may differ from the planned performance because of factors that are not in its control. The MYT regulation distinguishes between ‘controllable’ and ‘uncontrollable’ factors. Operation and maintenance expenses, depreciation, return on capital employed and collection efficiency are considered ‘controllable’ while power purchase cost and sales are considered ‘uncontrollable’. Every year, a utility is expected to submit its audited accounts to the regulator asking for a ‘true up’, that is, recognition of variation in expenditure and revenue from planned values. The ‘true up’ of accounts provides utilities an annual opportunity to argue for a tariff revision on the back of increases in uncontrollable costs.

Safeguarding consumer’s interests in such a business model calls for a high degree of regulatory expertise and vigilance. It also requires the utilities to be completely transparent in their operations. Unfortunately, the utilities have gone to court against attempts to bring them under the ambit of the RTI Act while the State Government itself has been reluctant to recommend a CAG audit of their accounts despite recommendations from the regulator for one[4].  

With this background we can look at the rationale for DERCs’ recent tariff orders.

In the ‘true up’ exercise for 2009-10 carried out in Aug 2011, the discoms argued for a price increase based on higher than anticipated power purchase costs. DERC revised tariffs and also introduced a new component – a ‘fuel price adjustment’ surcharge - that would allow the discoms to pass on a substantial part of increases in power purchase cost during the course of the year to consumers.

In the next ‘true up’ exercise, this time for 2010-11, carried out in July 2012, DERC accepted that the revenue shortfall of the discoms had cumulated to high levels till the end of 2011 despite the tariff increase of Sept. 2011. It revised tariffs upwards after estimating the power purchase costs for 2012-13 and succeeding years and also added another component to the tariff, a special surcharge to recover past shortfalls in revenue, besides modifying the ‘fuel price adjustment’ surcharge to a  ‘power purchase price adjustment’ surcharge.

It appears that DERC raised tariffs both times in response to a single factor deemed to be outside the control of the discoms – the increase in cost of power purchased by them.

Operational costs of a Delhi discom

The costs of discoms primarily engaged in retail supply may be broken up into the cost of power delivered to the distribution network and the distribution cost (including the discoms’ return on capital employed) and presented as average cost per unit (kWh) of power. The quantum of power billed to customers is less than the quantum of power procured by the utility because of distribution losses[5]. The cost of the lost power is borne by the billed customers.

Table 2 indicates the build up of costs for TPDDL. The figures till 2010-11 are ‘trued-up’ costs while the ones for 2012-13 are the projections that were used by DERC for changing tariffs.  

Table 2: Operational Costs of TPDDL


2008-09
2009-10
2010-11
2012-13 (P)
Power cost per input unit (A)
2.83
3.70
4.20
4.27
Distribution Loss B
19.00%
16.51%
12.39%
12.06%
Power cost per billed unit C=(A/(1-B))
3.50
4.43
4.80
4.86
Distribution cost per billed unit (D)
0.95
1.21
0.95
1.03
Total cost per billed unit (C+D))
4.45
5.64
5.75
5.89

Source: DERC ‘true up’ orders[6]
Notes: All costs in Rs/unit; P – DERC projections

In 2008-09 the average cost of power available with TPDDL for distribution to its customers was Rs 2.83/unit. After accounting for a 19% distribution loss, the cost of power increased to Rs 3.50/billed unit. Together with a distribution cost of 0.95/billed unit, the total cost of power supplied to the customer became Rs 4.45/billed unit. This was also indicative[7] of the average revenue per billed unit that had to be recovered from customers.

As the table indicates, reduction in distribution losses has reached a plateau for TPDDL and benefits for customers from loss reduction – a major argument advanced for privatization – have largely run their course. Distribution costs have remained largely under control except for a major blip in 2009-10 caused by staff salary increases arising from the sixth pay commission. Without accepting that distribution costs are at reasonable levels, it can still be seen that increase in the cost of electricity delivered to the customer is almost entirely driven by increase in the cost of purchased power.

The other discoms differ in their cost details, but the above conclusion holds for them too.

Adding up the cost of power

The bulk of the power needed for Delhi is procured through standing long term power purchase agreements with generation plants in the central and state sectors[8]. If power supplied from these plants is inadequate, the discoms must make their own arrangements to source power from elsewhere. They must also make arrangements to sell surplus power.

Selling power for short terms is pretty much unavoidable for Delhi’s discoms. With consumption being mainly domestic and commercial, there is a large variation in demand over the course of a day and because of Delhi’s extreme climate, demand also varies by season. The ratio of the same day peak load to minimum load in 2011 moved from 1.4 in summer to as high as 2.1 in winter and the ratio of summer peak load to winter minimum load was 3.1[9]. Catering to peak loads through long term contracts will entail selling power when the load decreases.

Table 3 shows how sourcing of power, transmission costs and losses and the sale of surplus power build up to the price of power available for distribution to the customer.

Table 3: Power cost build up for TPDDL and BRPL


2008-09
2009-10
2010-11
2012-13 (P)


Amount
Rate
Amount
Rate
Amount
Rate
Amount
Rate
TPDDL[10]
Long term purchase
89.7%
2.59
80.2%
2.81
82.4%
3.20
100.0%
3.71
Short term purchase
10.3%
4.35
19.8%
5.25
17.6%
5.56
0.0%
0.00
Transmission costs

0.20

0.22

0.28

0.26


Net purchase
100.0%
2.97
100.0%
3.52
100.0%
3.90
100.0%
3.97


Transmission losses
4.1%

5.4%

4.8%

4.9%

Excess sales
10.8%
5.00
8.9%
4.11
12.1%
2.96
35.5%
4.00
Net for customers
85.1%
2.86
85.7%
3.68
83.2%
4.25
59.6%
4.27
BRPL


Long term purchase
91.1%
2.57
81.5%
2.81
80.9%
3.20
100.0%
3.74
Short term purchase
8.9%
4.54
18.5%
5.36
19.1%
5.12
0.0%
0.00
Transmission costs

0.22

0.23

0.31

0.32


Net purchase
100.0%
2.96
100.0%
3.51
100.0%
3.88
100.0%
4.06


Transmission losses
4.4%

4.1%

5.7%

4.7%

Excess sales
8.8%
5.17
13.2%
3.66
16.9%
3.21
30.2%
4.00
Net for customers
86.8%
2.89
82.7%
3.66
77.4%
4.31
65.1%
4.39

Source: Discom ‘true up’ petitions[11] and DERC ‘true up’ orders
Notes: Rates are in Rs/unit; Amounts represent the percentage of total power procured; P - DERC projections

In 2008-09 TPDDL procured 89.7% of power through long term Power Purchase Agreements (PPA) at a cost of Rs 2.59/unit and the rest through short term power purchases at Rs 4.35/unit. After adding transmission costs, the average cost of power was Rs 2.97/unit. Transmission losses accounted for 4.1% of the power purchased and 10.8% was sold to other utilities. Surplus power could be sold at Rs 5/unit, much above the cost of power procured. This kept the cost of power available for distribution to TPDDL customers at Rs 2.87/unit, only 10% above the cost of long term power.

The situation changed dramatically for the worse in 2009-10. Expensive short term power purchases were resorted to, to a much larger extant and surplus power was sold at rates below the short term purchase rates. These transactions drove up the cost of power available for distribution to Rs 3.68/unit, a 30% mark up over the cost of long term power. Similar factors played out in 2010-11. In 2 years, TPDDLs cost of power for distribution went up by a whopping 49%.

The poor realizations on sale of surplus power have negative implications for the cost of power in the coming years. DERC’s projections for 2012-13 show that with the availability of power from newly commissioned plants, Delhi’s utilities will have a large surplus on hand[12]. TPDDL, for example, will have to dispose off over 35% of the power it purchases. DERC has optimistically assumed that this power can be sold at Rs. 4/unit when the realization was only Rs 2.96/unit for much smaller amounts of power in 2010-11, without giving any reasons for its optimism[13]. If these assumptions turn out incorrect, Delhi’s consumers are in for further sharp increases in tariff driven.

BRPL procurement costs display similar behaviour to TPDDL costs that have been analyzed above. In complete contrast to these two, the state owned distribution arm of NDMC was able to keep the cost of power available for distribution as low as Rs 0.62/unit and Rs 2.87/unit in 2008-09 and 2009-10 respectively[14]! The secret of this amazing feat was that NDMC was allocated enough ‘cheap’ long term power, obviating the need for short term purchases. Further, it was also able to sell its surplus - 43% of its allocated power in 2008-09 and 39% in 2009-10 - at a profit to other utilities.

Short term power purchase and sales were not the only reason for escalating power costs of the discoms. An examination of table 3 shows that the cost of long term power went up by about 24% over two years. Transmission costs went up inordinately and transmission losses too showed an upward trend[15].

The cost of power from the central sector and the state sector power generators is regulated by the Central Electricity Regulatory Commission (CERC) and the DERC respectively. It is a cost plus model, with assured returns for the power producers. The formula for the rate at which power is sold has two components – a ‘fixed’ part and a part that varies with the cost of fuel. Fuel cost increases are automatically passed on to the power purchasers while fixed costs are revisited in tariff orders by the regulators. The long term state owned power producers have been effectively inflation proofed!

The discretion in short term power trades

Since short term trades have played a huge role in escalating cost of power sold by the discoms, it will be useful to examine them in greater detail.

Delhi’s discoms have several options to meet their short term power requirements. They can procure power from each other (intra state) or make power banking arrangements with other utilities who have complimentary needs, ‘depositing’ power with their partners when they have it in excess and ‘withdrawing’ the power at a different point in time when they are in deficit. These are the most cost effective options. Power can also be bought a day ahead in power exchanges or based on bilateral term agreements with private producers at market prices. Finally, unscheduled interchange (UI) – by deficit or excess withdrawal of power - has the same cost implications as a sale or purchase of power but at rates that are related to the instantaneous demand – supply balance on the grid.

Table 4 shows how BRPL and TPDDL managed their short term power requirements in 2010-11. The dominant form of procurement was based on bilateral agreements. These purchases were made at rates far above the long term contract rate of Rs 3.20/unit prevailing in 2010-11. A similar pattern is evident in the short term power purchases of 2009-10.

Table 4: Short term power purchase and sales in 2010-11


TPDDL
BRPL


Amount
Rate
Amount
Rate
Purchase
Bilateral Agreements
59.6%
6.20
66.1%
5.67

Banking
24.7%
4.27
27.3%
4.02

Intra State
7.1%
4.44
4.3%
3.84

UI
5.9%
5.26
1.5%
3.33

Exchange
2.8%
6.65
0.8%
7.58


Sale
UI
71.1%
2.66
25.7%
2.71

Exchange
10.5%
3.67
44.1%
3.16

Banking
15.1%
3.76
9.0%
3.50

Bilateral Agreement
3.2%
3.53
20.6%
3.78

Intra State
0.2%
3.91
0.7%
3.98

Source: TPDDL ‘true up’ petition[16] and DERC ‘true up’ orders
Notes: Rates are in Rs/unit; Amounts represent the percentage of total purchases or sales

Delhi’s discoms entered into bilateral contracts mostly mediated by power trading companies, and sometimes directly with the generation companies. Their parent groups – Tata and Reliance ADAG – both have group companies engaged in power trading and contracts were often made through these companies. The companies in the ‘merchant power’ market are power companies that have not tied up a part or the whole of their output in long term contracts, or companies in other industries that have captive power generation at their disposal.

A prominent supplier of merchant power for Delhi has been Jindal Power (JPL), carrying a reputation as the first company to operate a power plant entirely on a merchant basis. JPL’s high cost power is, ironically, fuelled by low cost coal from captive coal blocks that were allocated to it by the Government[17]. Delhi has other merchant suppliers like Lanco Infratech and GMR who have had access to gas at government controlled prices from the Krishna Godavari basin[18] for their power plants.

In several cases, the discoms show the purchases from power trading companies and the actual suppliers name is not made public. There is also a wide variation in power purchase rates (In TPDDL’s case for example, prices varied from Rs 5.48/unit to Rs 7.59/unit in 2010-11). As DERC observed in July 2012[19], contracts were largely made by the utilities without following any competitive process and often many months in advance of the power requirements.

All this points to the complete lack of transparency in short term power procurement contracts and raises the suspicion that the distribution utilities may not be putting in their best efforts towards reducing the cost of power procured.

The disposal of the surplus power with the distribution utilities confirms this suspicion. A large fraction of this power is not even actively sold, but simply not withdrawn from the grid to realize UI (under draw) rates which are lower than any category of sale and far below the average rates at which the power has been purchased.

DERC has been content with gently chiding the utilities, stating that “there was scope for better management of the process of short term power purchase and sale of surplus power so as to significantly promote the interests of the consumers”[20], that too in July 2012, while this process has been working against the interest of customers from 2009-10.

The poor management of the purchase and sale of power by the distribution utilities is not particularly surprising considering that the cost of power is a pass through cost as far as the utilities are concerned and in no way affects their profits.

Concluding remarks

Several factors - increases in long term power rates, non-availability of long term power in adequate quantity leading to purchase of expensive short term power and low realization for surplus power – have contributed to the massive increase in the cost of power available for distribution.

When Delhi’s electricity distribution was privatized in 2002, the focus of the regulators was on controlling the cost of distribution and reducing the technical and commercial losses in the network. Power was allocated and its cost set by the government; the cost of power was considered a pass through as far as the operations of the distribution utilities were concerned.

Over the years, significant changes have happened in the electricity generation and trading business with private producers, traders and exchanges coming into play with merchant power. Trading in electricity has become an important part of the operations of a distribution utility, especially one servicing a metro, and involves significant discretionary spending and sales.

The regulator has been slow to respond to this changed environment and its actions to bring greater transparency into power trades by the utilities appear ineffective[21].

The larger problem however lies in the unregulated electricity market. Delhi’s consumers are paying not only for the regulated guaranteed profits of the state owned generation and transmission companies and private distribution companies, but also for the unregulated profiteering of the merchant producers and other market players.

Kannan Kasturi

Email: kasturi_kannan@yahoo.com

(Kannan Kasturi is an independent researcher and writes on public interest and policy)

References:

Prayas (2012): “Electricity in Megacities – A working paper by Prayas Energy Group, Pune”, July 2012, (http://www.prayaspune.org/peg/publications/item/176.html) accessed on 12 Nov 2012

Notes:


[1] The government provides a subsidy of Rs 1/unit for consumers using less than 200 units per month.
[2] Available at DERC website http://www.derc.gov.in/
[3] Section 61 (d) of the Electricity Act (2003)
[4] See Smriti Kak Ramachandran: “RWAs want CAG audit of discoms’ accounts” The Hindu, Oct 4, 2012 (http://www.thehindu.com/todays-paper/tp-national/tp-newdelhi/rwas-want-cag-audit-of-discoms-accounts/article3963533.ece) accessed on 12 Nov 2012
[5] Distribution loss refers to the power input into the distribution network that the discom cannot account for, either because it has been lost during transmission or stolen. It is calculated as the fraction of the power that cannot be billed to customers. 
[6] See note 2
[7] The actual average rate per billed unit would be slightly higher as it would also need to include any performance incentives for which the discom has qualified.
[8] This is set to change from 2012 with TPDDL signing a long term PPA with Jhajjar Power Ltd., a private power generation firm.
[9] These figures have been taken from Sec. 3.1 of Prayas (2012)
[10] The cost of electricity available for distribution to TPDDL customers reported in this table marginally differs from the figures in Table 2 as the latter uses DERC ‘trued-up’ figures while the former is based on figures reported by TPDDL in its ‘true-up’ petition.
[11] TPPDL ‘true up’ petition for 2010-11 is available at its website www.ndpl.com. All other ‘true up’ petitions are to be found (if at all) at the DERC website
[12] Delhi government has ‘surrendered’ some long term power allocated to it. See PTI: “Reallocate 1700 MW planned to be surrendered by Delhi to TN” Business Standard, Oct 24, 2012  (http://www.business-standard.com/generalnews/news/reallocate-1700-mw-planned-to-be-surrendered-by-delhi-to-tn/71962/) accessed on 12 Nov 1012
[13] See sections 4.126, 4.127 and 4.128 of DERC TPDDL ‘true up’ order, July 2012 available at the DERC website.
[14] See NDMC ‘true up’ petition for 2008-09 and DERC ‘true up’ order for NDMC for 2009-10 available at DERC website.
[15] The higher transmission costs are due to Delhi Transco, a state utility, hiking its charges. Larger transmission losses are due to a larger proportion of power being sourced from outside the state.  
[16] See note 11
[17] See Noor Mohammad: “Jindal Power ignores coal min directive on merchant sale of power” Financial Express, Jul 30, 2012 (http://www.financialexpress.com/news/jindal-power-ignores-coal-min-directive-on-merchant-sale-of-power/981306/2) accessed on 12 Nov 2012
[18] See Subhash Narayan, Noor Mohammad: “Lanco, GMR plants face cut in gas allocation” Financial Express, Feb 20, 2012 (http://www.financialexpress.com/news/lanco-gmr-plants-face-cut-in-gas-allocation/914245/0) accessed on 12 Nov 2012
[19] See Sec 3.86 of DERC TPPDL July 2012 order and Sec 3.103 of DERC BRPL July 2012 order.
[20] ibid
[21] Guidelines for short term power trades by discoms were issued by DERC in Jan 2011. While the guidelines require that discoms update their annual requirements/surplus of electricity at the end of every month on their website, a visit to the BRPL website (www.bsesdelhi.com) on 12 Nov 2012 showed that the ‘anticipated shortage/surplus’ information was last updated on 30 July 2012.

Wednesday, December 5, 2012

Indian direct investment abroad


My article with this title appeared in the Dec 8 2012 issue of the Economic & Political Weekly as a commentary. It is reproduced below. The article has been quoted in the India blog of New York Times here


A considerable part of the discussion on economic policy in India is devoted to foreign investment in Indian equity and debt securities. The reverse flow of capital from India into foreign equity and debt, though equally important for this discussion, attracts far less attention in the financial media and is the subject of this paper.

A rapid rise in the flow of Indian investments abroad was noted early on by Nagraj (2006). Nayyar (2008) extensively analysed investment by Indian firms in the context of international investment from developing countries using all available data. Both these studies used data up till 2006; since then, India’s investments abroad have grown manifold as we will see later.

More recently, Chalapati Rao and Dhar (2011) have examined direct investments from India in a critique of the policy regime governing cross-border direct investment flows. They look at the sector wise composition of investments, derived from recently available RBI data, as well as at individual cases to understand why Indian business houses are investing abroad.

A major concern of this paper is with the official investment data. The RBI provides a confusing array of data sets[1] relating to outward investments. This paper begins by looking for clues in RBI’s regulations and accounting practices to reconcile the different data sets. It goes on to uncover some of the key features of the outward investments and concludes by examining the shortcomings in the regulatory environment which allow the end use of investments to remain mostly opaque.

RBI’s accounting practices

The Reserve Bank of India (RBI) regulates cross-border investment in securities and is the primary repository of data on investment by Indian entities abroad. Following International Monetary Fund standards, RBI presents Indian investment abroad involving equity and debt securities (other than those held by the RBI as reserve assets) under two heads - ‘direct investment’ and ‘portfolio investment’ (RBI, 2010).

While ‘direct investment’, carries the usual connotation of being investment made with the objective of obtaining a “lasting interest and control” in a foreign enterprise, the key characteristic of ‘portfolio investment’ is considered its “negotiability”, facilitating ready withdrawal of investment by the investor.

RBI regulations[2] permit various Indian entities including companies, mutual funds, and individuals to invest in equity and debt of foreign entities. Each entity has multiple avenues for making overseas investments. Companies can set up or acquire Joint Ventures (JV) or Wholly Owned Subsidiaries (WOS) abroad and invest in them. They can also invest in the securities of unrelated foreign companies (neither JV nor WOS). Individuals can invest in the equity of companies directly as well acquire a portfolio through the medium of mutual funds. The question under consideration is how RBI categorizes different investors and the different avenues of investment abroad as ‘direct’ or ‘portfolio’ investment.

The RBI Balance of Payments Manual (RBI 2010) documents “current practices” in compiling Balance of Payments statistics. According to the manual[3], the main component of ‘direct investment’ is the investment by Indian entities in equity and debt of JV companies or WOS. Another component is the investment by banks in their branches abroad. Investments by mutual funds and investment by Indian companies in equity and debt securities of unrelated foreign companies is considered ‘portfolio investment’. The manual is formally silent about the treatment of investments by individuals in foreign securities, but there are hints[4] that these are being included in ‘direct investment’ instead of ‘portfolio investment’ where they should belong.

However, what has been described above is only “current practice”. Going back in time, reveals other practices. Companies were permitted to invest directly in non-related foreign entities that had a minimum of 10% holding in a listed Indian company, from Jan 2003[5]; such investments were opened up to Mutual funds and even individual investors and all these investments were considered ‘direct investments’.[6] The condition restricting this form of investment to companies with 10% Indian holding was dropped, first for mutual funds in July 2006[7] and then for companies in Sept 2007[8]. However, Foreign Exchange Management Regulation of Dec 2007[9] still called such investments ‘direct investment’.

RBI documentation down to the present[10] continues to shirk from providing sharp distinctions between ‘portfolio investment’ and ‘direct investment’, an indication that there have been no strong reasons from a policy perspective for RBI to distinguish between the two[11].

With this background, we proceed to look at the different data sets from RBI on investments abroad[12].

The disinterest in portfolio investment

Cross-border investments are available in two periodic statements of the RBI – the Balance of Payments (BOP) and the International Investment Position (InIP). The BOP statement reveals the movement of capital over a period while the InIP statement shows the stock of international financial assets and liabilities, held as direct and portfolio investment, at the end of a period.[13]

Table 1 contains select data from InIP statements showing the stock of India’s ‘direct investment’ and ‘portfolio investment’ abroad. India’s investment abroad is overwhelmingly in the form of direct investment and is growing rapidly. The remainder of this paper will be confined to a discussion of direct investment.

Cross-border flows of direct investment

Table 2 shows the net yearly flow of direct investments out of and into India (columns A and D respectively). Heightened flows are observed in both directions from 2006-07. Data from the table shows that net Indian direct investment abroad in the last six years is just over 50% of the net FDI that has come into India. Interestingly, the percentage is the same if the comparison is extended to the last decade.

A closer look at the components of direct investment provides additional insights. Following IMF standards, direct investment flows reported by RBI include flows into equity and debt as well as reinvested earnings[16]. Columns B and E in Table 2 show the reinvested earnings of Indian investment abroad and FDI in India respectively. While the reinvested earnings of foreign capital show a steady increase over the years, the reinvested earnings of Indian capital abroad have remained constant from 2005-06 in a period when the stock of  investment increased over 10 times (see Table 1). RBI figures of reinvested earnings of Indian companies seem doubtful[17].

A useful comparison between direct investment flowing abroad and FDI flowing into India is from the point of view of how they affect the balance of payments. In such a comparison, reinvested earnings must be excluded from the flows as they do not affect the balance of payments[18]. Figure 1 shows the yearly flow of Indian direct investments abroad and FDI in India after excluding reinvested earnings in both cases.

 Intriguingly, as the figure shows, outflows have moved more or less in tandem with FDI inflows between 2002-03 and 2009-10. Net annual outflows rose sharply between 2004-05 and 2006-07 to plateau at higher levels, with the exception of a sharp dip[19] in 2011-12. In 2010-11, from a balance of payments perspective, more direct investment went out of India than came into India! Again, from the same perspective, the net outflow in the last six years is nearly 65% of the net inflow, showing the extent to which the contribution of FDI to shoring up India’s balance of payments is negated by outward investments.

Another point of interest is the performance of India’s direct investments abroad in terms of the return on investment. Unfortunately, the data available publicly is rather limited in extent and quality. There are two components to the returns – earnings reinvested abroad and dividend and profits repatriated. The unreliable nature of the estimates of the earnings reinvested abroad has already been pointed out. The data on dividend and profits is available only up till 2008-09[20]. It shows maximum yearly dividend and profits of under $ 0.5 billion on an investment stock that amounted to nearly $ 50 billion by the start of 2008-09. The announcement of a 50% reduction in the tax rate on dividends from investments in joint ventures and subsidiaries abroad in the last budget[21] is an indirect admission by the government that dividend repatriation is below expectations.

Disaggregating direct investments

As has been noted earlier, RBI data on Indian direct investment abroad aggregates several categories of investments including investments by Indian entities in Joint Ventures (JV) and Wholly Owned Subsidiaries (WOS). More recently, RBI has started making another data set publicly available - the outward investment flow into JV/WOS abroad as reported by authorized dealers[22].

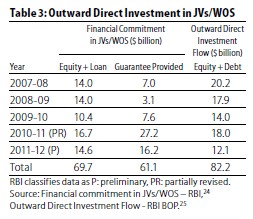
The financial commitments of Indian entities towards their JV/WOS abroad are in the form of equity, loans and guarantees. The equity and loan components together constitute the outward investment flow into JV/WOS. The guarantees (backed by assets in India), provided to obtain financing abroad, do not entail an immediate flow of funds. Table 3 shows these components of the financial commitment in JV/WOS. It also contains the outward direct investment in equity and debt reported in the BOP[23] statements for comparison.


The cumulative investment into JV/WOS abroad by Indian entities in the last five years has been to the tune of nearly $70 billion, while the cumulative direct investment is a little over $82 billion. Investment in JV/WOS forms the most part – nearly 85% - of outward direct investment.

However, a substantial amount - $12 billion spread over five years - is being invested elsewhere (unless RBI data on JV/WOS investments is somehow incomplete). This would include investment of banks in their branches abroad and investments by individuals. One hopes that in the interest of greater transparency, RBI will also provide details of these investments in future.

Table 3 reveals another important feature of the financial commitments in JV/WOS abroad, namely the large guarantee component, pointing to the highly leveraged nature of acquisitions by Indian companies. The financial commitment made in the form of guarantees is about 47% of total financial commitments made in the last 5 years. Guarantees have been rarely invoked in the past[26]. However, with the strong possibility of acquired companies failing to perform in a deteriorating economic environment, mounting guarantees pose heightened risks to Indian banks backing the guarantees made by companies.   

An important attribute of the RBI data is that it allows the identification of investing entities by name and provides the amounts they have invested. An analysis of the data for the last five years (July 2007 – June 2011) reveals[27] that just over 380 companies have invested over $10 million each and account for over 82% of the investments flowing abroad in the last five years.

Grouping the companies by business conglomerates shows the ten largest outward investor groups to be Tata, Bharti Airtel, Essar, Gammon, Reliance, Religare, Suzlon, Reliance – ADAG, Vedanta and United Phosphorous in that order. These groups, through their 35 odd companies, account for more than a third of the investment outflows for this period. Just five of these groups – Tata, Bharti Airtel, Reliance, Reliance-ADAG, and Suzlon account for over half of the total guarantees extended for this period.

The opaqueness of investments in foreign ventures

The main drawback of the RBI data on JV/WOS is that it identifies only the immediate recipient of the investment. These by and large turn out to be intermediaries - shell companies that do not have any operations; few Indian companies directly invest in the company that is the actual target of their investment.

There is a marked preference for locating these intermediaries in Singapore, Mauritius, and Netherlands - countries that provide an attractive ‘tax neutral’ regime for holding companies. These have been the top three investment destinations for Indian investors’, together accounting for over 55% of the outward investment in the period April 2008 to Feb 2012.[28]

The distancing of the foreign target from the Indian investor is often through multiple layers of shell companies. Multi-tiered intermediate structures located across several countries are justified as necessary to exploit tax treaties between different countries to the most advantage. With RBI regulations not insisting on full disclosure of how investments are routed to the target companies[29], these complex structures make it difficult to identify the actual destination of the investments and its end use, unless the investors volunteer this information.

With a liberal policy regime in place, companies can generally make investments without seeking prior approval, within generous limits[30]. Combined with a weak regulatory environment, this leaves enough room for investment from India to be channeled into areas prohibited by regulation, such as real estate and banking, or else be ‘round tripped’. ‘Round tripping’ allows investors to hide their identity and avoid taxes by taking the investment out of India and bringing it back under the cloak of foreign investment.

The opportunity for tax arbitrage arises from the differential tax treatment meted out by India to foreign investors from certain countries in comparison to Indian investors. Mauritius and Singapore are popular staging points for investing in India. India’s tax treaties with these countries allows investors coming through intermediaries based there to avoid paying taxes on capital gains made in India.

The existence of ‘round-tripping’ is periodically confirmed by media reports on investigations into suspect cases[31]. The RBI is aware of the problems with the policy on direct investments abroad and it appears that these have been transmitted to the government[32]. The government, however, has chosen to maintain the status quo.

Concluding remarks

Export of capital by Indian companies rose dramatically in tandem with FDI and measures up to a sizeable fraction of the FDI inflows over the last six years. While there is a keen debate on the public interest in allowing or limiting FDI, it is surprising given its scale, that there is no such engagement with Indian direct investment abroad.

The government justifies the public interest in this policy by repeating the ‘textbook’ benefits – the markets that will open up for Indian goods and services increasing exports and employment, the technology and skills infusion that will take place, or the energy resources that will be secured for India’s benefit.

It is difficult to evaluate if any of these benefits indeed accrue to India, given the absence of even basic data on the end use of investments, leave alone metrics designed to measure the efficacy of policy. What is clear from the enthusiasm with which India’s business conglomerates export capital is that the policy certainly works in their interest.

References:

Chalapathi Rao, KS and B Dhar (2011): “Formulating India’s FDI Policy: Waiting for Godot” in Alternate Survey Group, Indian Political Economy Association (ed) Economic Growth & Development in India: Deepening Divergence (New Delhi: Yuva Samvad Prakashan)
Khan, HR (2012): “Outward Indian FDI - Recent trends and emerging issues” in RBI Monthly Bulletin, April 2012, (http://www.rbi.org.in/scripts/BS_ViewBulletin.aspx) last accessed on 8 Aug 2012
Nagaraj, R (2006): “Indian Investments Abroad”, Economic & Political Weekly, Vol - XLI No. 46, November 18, 2006
Nayyar, Deepak (2008): “The Internationalization of Firms From India: Investment, Mergers and Acquisitions”, Oxford Development Studies, Taylor and Francis Journals, vol. 36(1), pages 111-131
RBI (2010): Balance of payments manual for India (Mumbai: RBI), (http://www.rbi.org.in/Scripts/PublicationsView.aspx?Id=13013) last accessed on 7 Aug 2012

Notes:


[1] RBI puts out data on outward investment from India as part of the Balance of Payments statement and in monthly press releases on “Overseas Direct Investment”. RBI also occasionally publishes articles on Indian direct investment abroad in its monthly bulletins. For a recent example of the latter, see Table 1 in Khan (2012).
[2] The latest regulations are available in RBI’s “Master Circular on Direct Investment by Residents in Joint Venture (JV)/ Wholly Owned Subsidiary (WOS) Abroad, July 02, 2012” (http://www.rbi.org.in/scripts/BS_ViewMasCirculardetails.aspx?id=7352), last accessed on 7 Aug 2012.
[3] See sections 5.59 to 5.61 and 5.68 of RBI (2010).
[4] See section 6.20 of RBI (2010) - “On the issue of survey on outward portfolio investments ....  transactions of high net-worth individuals are not being included.” See also the comments at the end of Table 1 in the article “Indian Investment Abroad in Joint Ventures and Wholly Owned Subsidiaries: 2009-10 (April-March)” in the RBI monthly bulletin of July 2010.
[5] RBI circular “A.P. (DIR Series) Circular No.66 dated Jan 13, 2003” (http://www.rbi.org.in/scripts/NotificationUser.aspx?Id=1038&Mode=0), last accessed on 8 Aug 2012
[6] RBI regulation “Foreign Exchange Management (Transfer or Issue of any Foreign Security) (Second Amendment) Regulations, 2003” (http://rbi.org.in/Scripts/BS_FemaNotifications.aspx?Id=1300) last accessed on 8 Aug 2012.
[7] RBI circular “A.P. (DIR Series) Circular No. 3 dated July 26, 2006” (http://www.rbi.org.in/Scripts/NotificationUser.aspx?Id=3028&Mode=0), last accessed on 8 Aug 2012
[8] RBI circular “A. P. (DIR Series) Circular No.11 dated Sept 26, 2007” (http://www.rbi.org.in/Scripts/NotificationUser.aspx?Id=3833&Mode=0), last accessed on 8 Aug 2012
[9] RBI Regulation “Foreign Exchange Management (Transfer or Issue of any Foreign Security) (Third Amendment) Regulations, 2007” (http://rbi.org.in/Scripts/BS_FemaNotifications.aspx?Id=4652) read along with “Foreign Exchange Management (Transfer or Issue of Any Foreign Security) (Amendment) Regulations, 2004” (http://rbi.org.in/Scripts/BS_FemaNotifications.aspx?Id=2126) last accessed on Aug 8 2012
[10] In the latest available regulations (referenced in note 2), Section B6.1(i) concerning “Portfolio investments by listed Indian companies” is a subsection of Section B titled “Direct Investment outside India”
[11] This is in line with the assertion made by Chalapati Rao and Dhar (2011:111) that regulations for investing abroad have been primarily designed to “move towards full capital account convertibility”
[12] The dataset in Khan (2012: Table 1) on outflows in respect of outward FDI has not been considered in this paper as it does not come with any explanation of how it can be reconciled with BOP data.
[13] See section 2.3 of RBI (2010) for the differences between BOP and InIP data.
[14] RBI puts out InIP data in press releases every quarter. The data up to Mar 2012 is available at (http://www.rbi.org.in/scripts/BS_PressReleaseDisplay.aspx?prid=26761), last accessed on 8 Aug 2012
[15] BOP statement is included in the Reserve Bank of India Bulletin issued every month, available at the RBI website (http://www.rbi.org.in)
[16] Earnings from pre-existing direct investment may be reinvested in the enterprise or paid out as dividend.
[17] Poor data has been attributed in the past to RBI’s data collection through a “Survey of India’s Foreign Liabilities and Assets” to which it was not mandatory for companies to respond. The author is unaware of the current practice.  
[18] Reinvested earnings of FDI in India appear as a credit entry under the ‘foreign direct investment’ head of the ‘capital account’ of the BOP and as a debit entry under the ‘investment income’ head of the ‘current account’. Reinvested do not affect the balance of payments. Indian investment abroad is similarly treated.
[19] There is some inconsistency in RBI data that could account in part for the sharp dip. This inconsistency is also seen in RBI’s figure on investments in joint ventures and subsidiaries (see Table 3) for 2011-12 which are higher than its BOP figure for the total direct investment outflow.
[20] See “Invisibles in India’s Balance of Payments: An Analysis of Trade in Services, Remittances and Income” Mar 10, 2010 available at http://www.rbi.org.in/scripts/BS_ViewBulletin.aspx?Id=11029 last accessed on 27 Sept 2012
[21] This tax concession has been noted by Khan (2012: para 43)
[22]  Data on Outward Direct Investment is published every month by the RBI and is available at (http://www.rbi.org.in/scripts/Data_Overseas_Investment.aspx), last accessed on 8 Aug 2012
[23] In this table, the outward direct investment abroad is the direct investment in equity and debt in that year and does not include reinvested earnings or the proceeds of disinvestment.
[24] See note 24
[25] For BOP data see note 17
[26] See table 1 in Khan(2012) for the guarantees invoked each year
[27] Analysis carried out by the author using outward direct investment flow data (note 24).
[28] Calculated from the data in table 4 of Khan (2012)
[29] The reporting requirements are specified in Appendix A of the ‘master circular’ detailed in note 2
[30] Exhibit 1 in Section E of Khan (2012) explains how the policy has been ‘relaxed’ in the last few years   
[31] See for example the PTI report “Mauritius funds into Indian stocks face Sebi, RBI probe” Times of India, July 22, 2012 (http://timesofindia.indiatimes.com/business/india-business/Mauritius-funds-into-Indian-stocks-face-Sebi-RBI-probe/articleshow/15090438.cms) accessed on Aug 8 2012