My article with this title appeared in the Dec 8 2012 issue of the Economic & Political Weekly as a commentary. It is reproduced below. The article has been quoted in the India blog of New York Times here

A considerable part of the discussion on economic policy in India
is devoted to foreign investment in Indian equity and debt securities. The
reverse flow of capital from India
into foreign equity and debt, though equally important for this discussion, attracts
far less attention in the financial media and is the subject of this paper.
A rapid
rise in the flow of Indian investments abroad was noted early on by Nagraj
(2006). Nayyar (2008) extensively analysed investment by Indian firms in the
context of international investment from developing countries using all
available data. Both these studies used data up till 2006; since then, India
More recently, Chalapati Rao and Dhar (2011) have examined
direct investments from India
in a critique of the policy regime governing cross-border direct investment
flows. They look at the sector wise composition of investments, derived from
recently available RBI data, as well as at individual cases to understand why
Indian business houses are investing abroad.
A major
concern of this paper is with the official investment data. The RBI
provides a confusing array of data sets[1] relating to outward investments. This
paper begins by looking for clues in RBI’s regulations and accounting practices
to reconcile the different
data sets. It goes on to uncover some of the key features of the outward
investments and concludes by examining the shortcomings in the regulatory
environment which allow the
end use of investments to remain mostly opaque.
RBI’s accounting practices
The Reserve Bank of India (RBI) regulates cross-border
investment in securities and is the primary repository of data on investment by
Indian entities abroad. Following International Monetary Fund standards, RBI
presents Indian investment abroad involving equity and debt securities (other
than those held by the RBI as reserve assets) under two heads - ‘direct investment’
and ‘portfolio investment’ (RBI, 2010).
While ‘direct investment’, carries the usual connotation of
being investment made with the objective of obtaining a “lasting interest and
control” in a foreign enterprise, the key characteristic of ‘portfolio
investment’ is considered its “negotiability”, facilitating ready withdrawal of
investment by the investor.
RBI regulations[2] permit various Indian entities
including companies, mutual funds, and individuals to invest in equity and debt
of foreign entities. Each entity has multiple avenues for making overseas
investments. Companies can set up or acquire Joint Ventures (JV) or Wholly
Owned Subsidiaries (WOS) abroad and invest in them. They can also invest in the
securities of unrelated foreign companies (neither JV nor WOS). Individuals can
invest in the equity of companies directly as well acquire a portfolio through
the medium of mutual funds. The question under consideration is how RBI
categorizes different investors and the different avenues of investment abroad
as ‘direct’ or ‘portfolio’ investment.
The RBI Balance of Payments Manual (RBI 2010) documents
“current practices” in compiling Balance of Payments statistics. According to
the manual[3],
the main component of ‘direct investment’ is the investment by Indian entities
in equity and debt of JV companies or WOS. Another component is the investment
by banks in their branches abroad. Investments by mutual funds and investment
by Indian companies in equity and debt securities of unrelated foreign companies
is considered ‘portfolio investment’. The manual is formally silent about the
treatment of investments by individuals in foreign securities, but there are
hints[4]
that these are being included in ‘direct investment’ instead of ‘portfolio
investment’ where they should belong.
However, what has been described above is only “current
practice”. Going back in time, reveals other practices. Companies were
permitted to invest directly in non-related foreign entities that had a minimum
of 10% holding in a listed Indian company, from Jan 2003[5];
such investments were opened up to Mutual funds and even individual investors
and all these investments were considered ‘direct investments’.[6]
The condition restricting this form of investment to companies with 10% Indian holding
was dropped, first for mutual funds in July 2006[7]
and then for companies in Sept 2007[8].
However, Foreign Exchange Management Regulation of
Dec 2007[9]
still called such investments ‘direct investment’.
RBI documentation down to the
present[10]
continues to shirk from providing sharp distinctions between ‘portfolio investment’
and ‘direct investment’, an indication that there have been no strong reasons
from a policy perspective for RBI to distinguish between the two[11].
With this background, we proceed to
look at the different data sets from RBI on investments abroad[12].
The
disinterest in portfolio investment

Cross-border investments are available in two periodic statements of the RBI – the Balance of Payments (BOP) and the International Investment Position (InIP). The BOP statement reveals the movement of capital over a period while the InIP statement shows the stock of international financial assets and liabilities, held as direct and portfolio investment, at the end of a period.[13]
Table 1 contains select data from InIP statements showing
the stock of India ’s
‘direct investment’ and ‘portfolio investment’ abroad. India ’s
investment abroad is overwhelmingly in the form of direct investment and is
growing rapidly. The remainder of this paper will be confined to a discussion
of direct investment.
Cross-border flows of direct investment
Table 2 shows the net yearly flow of direct investments out
of and into India
(columns A and D respectively). Heightened
flows are observed in both directions from 2006-07. Data from the table shows
that net Indian direct investment abroad in the last six years is just over 50%
of the net FDI that has come into India. Interestingly, the percentage is the
same if the comparison is extended to the last decade.

A closer look at the
components of direct investment provides additional insights. Following IMF
standards, direct investment flows reported by RBI include flows into equity
and debt as well as reinvested earnings[16]. Columns
B and E in Table 2 show the reinvested earnings of Indian investment abroad and
FDI in India respectively. While the reinvested earnings of foreign capital
show a steady increase over the years, the reinvested earnings of Indian
capital abroad have remained constant from 2005-06 in a period when the stock
of investment increased over 10 times
(see Table 1). RBI figures of reinvested earnings of Indian companies seem
doubtful[17].
A useful comparison between
direct investment flowing abroad and FDI flowing into India is from the point
of view of how they affect the balance of payments. In such a comparison,
reinvested earnings must be excluded from the flows as they do not affect the
balance of payments[18]. Figure
1 shows the yearly flow of Indian direct investments abroad and FDI in India
after excluding reinvested earnings in both cases.

Intriguingly, as the figure shows, outflows have moved more
or less in tandem with FDI inflows between 2002-03 and 2009-10. Net annual outflows
rose sharply between 2004-05 and 2006-07 to plateau at higher levels, with the exception
of a sharp dip[19] in 2011-12. In 2010-11, from a
balance of payments perspective, more direct investment went out of India than
came into India! Again, from the same perspective, the net outflow in the last six
years is nearly 65% of the net inflow, showing the extent to which the contribution
of FDI to shoring up India’s balance of payments is negated by outward
investments.
Another point of interest is the performance of India ’s
direct investments abroad in terms of the return on investment. Unfortunately, the data available publicly is rather
limited in extent and quality. There are two components to the returns –
earnings reinvested abroad and dividend and profits repatriated. The unreliable
nature of the estimates of the earnings reinvested abroad has already been
pointed out. The data on dividend and profits is available only up till 2008-09[20]. It
shows maximum yearly dividend and profits of under $ 0.5 billion on an
investment stock that amounted to nearly $ 50 billion by the start of 2008-09.
The announcement of a 50% reduction in the tax rate on dividends from
investments in joint ventures and subsidiaries abroad in the last budget[21]
is an indirect admission by the government that dividend repatriation is below
expectations.
Disaggregating direct investments
As has been noted earlier, RBI
data on Indian direct investment abroad aggregates several categories of
investments including investments by Indian entities in Joint Ventures (JV) and
Wholly Owned Subsidiaries (WOS). More recently, RBI has started making another
data set publicly available - the outward investment flow into JV/WOS abroad as
reported by authorized dealers[22].
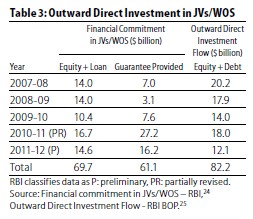
The financial commitments of
Indian entities towards their JV/WOS abroad are in the form of equity, loans
and guarantees. The equity and loan components together constitute the outward
investment flow into JV/WOS. The guarantees (backed by assets in India ), provided to obtain financing abroad, do not entail an
immediate flow of funds. Table 3 shows these components of the financial
commitment in JV/WOS. It also contains the outward direct investment in equity
and debt reported in the BOP[23]
statements for comparison.
The cumulative investment into
JV/WOS abroad by Indian entities in the last five years has been to the tune of
nearly $70 billion, while the cumulative direct investment is a little over $82
billion. Investment in JV/WOS forms the most part – nearly 85% - of outward
direct investment.
However, a substantial amount - $12
billion spread over five years - is being invested elsewhere (unless RBI data
on JV/WOS investments is somehow incomplete). This would include investment of
banks in their branches abroad and investments by individuals. One hopes that
in the interest of greater transparency, RBI will also provide details of these
investments in future.
Table 3 reveals another important
feature of the financial commitments in JV/WOS abroad, namely the large
guarantee component, pointing to the highly leveraged nature of acquisitions by
Indian companies. The financial commitment made in the form of guarantees is
about 47% of total financial commitments made in the last 5 years. Guarantees
have been rarely invoked in the past[26].
However, with the strong possibility of acquired companies failing to perform
in a deteriorating economic environment, mounting guarantees pose heightened
risks to Indian banks backing the guarantees made by companies.
An important attribute of the RBI
data is that it allows the identification of investing entities by name and provides
the amounts they have invested. An analysis of the data for the last five years
(July 2007 – June 2011) reveals[27]
that just over 380 companies have invested over $10 million each and account
for over 82% of the investments flowing abroad in the last five years.
Grouping the companies by business
conglomerates shows the ten largest outward investor groups to be Tata, Bharti
Airtel, Essar, Gammon, Reliance, Religare, Suzlon, Reliance – ADAG, Vedanta and
United Phosphorous in that order. These groups, through their 35 odd companies,
account for more than a third of the investment outflows for this period. Just
five of these groups – Tata, Bharti Airtel, Reliance, Reliance-ADAG, and Suzlon
account for over half of the total guarantees extended for this period.
The opaqueness of investments
in foreign ventures
The main drawback of the RBI data
on JV/WOS is that it identifies only the immediate recipient of the investment.
These by and large turn out to be intermediaries - shell companies that do not
have any operations; few Indian companies directly invest in the company that
is the actual target of their investment.
There is a marked preference for
locating these intermediaries in Singapore , Mauritius , and Netherlands - countries that provide an attractive ‘tax neutral’
regime for holding companies. These have been the top three investment
destinations for Indian investors’, together accounting for over 55% of the
outward investment in the period April 2008 to Feb 2012.[28]
The distancing of the foreign
target from the Indian investor is often through multiple layers of shell
companies. Multi-tiered intermediate structures located across several
countries are justified as necessary to exploit tax treaties between different
countries to the most advantage. With RBI regulations not insisting on full
disclosure of how investments are routed to the target companies[29], these
complex structures make it difficult to identify the actual destination of the
investments and its end use, unless the investors volunteer this information.
With a liberal policy regime in place, companies can generally
make investments without seeking prior approval, within generous limits[30]. Combined with a weak regulatory environment, this leaves
enough room for investment from India to be channeled into areas prohibited by regulation, such
as real estate and banking, or else be ‘round tripped’. ‘Round tripping’ allows
investors to hide their identity and avoid taxes by taking the investment out
of India and bringing it back under the cloak of foreign investment.
The opportunity for tax arbitrage
arises from the differential tax treatment meted out by India to foreign investors from certain countries in comparison
to Indian investors. Mauritius and Singapore are popular staging points for investing in India . India’s tax treaties with these countries allows investors
coming through intermediaries based there to avoid paying taxes on capital
gains made in India.
The existence of ‘round-tripping’
is periodically confirmed by media reports on investigations into suspect cases[31]. The
RBI is aware of the problems with the policy on direct investments abroad and it
appears that these have been transmitted to the government[32]. The
government, however, has chosen to maintain the status quo.
Concluding remarks
Export of capital by Indian companies rose dramatically in
tandem with FDI and measures up to a sizeable fraction of the FDI inflows over
the last six years. While there is a keen debate on the public interest in
allowing or limiting FDI, it is surprising given its scale, that there is no
such engagement with Indian direct investment abroad.
The government justifies the public interest in this policy
by repeating the ‘textbook’ benefits – the markets that will open up for Indian
goods and services increasing exports and employment, the technology and skills
infusion that will take place, or the energy resources that will be secured for
India’s benefit.
It is difficult to evaluate if any of these benefits indeed
accrue to India, given the absence of even basic data on the end use of
investments, leave alone metrics designed to measure the efficacy of policy.
What is clear from the enthusiasm with which India ’s
business conglomerates export capital is that the policy certainly works in
their interest.
References:
Khan, HR (2012): “Outward Indian
FDI - Recent trends and emerging issues” in RBI Monthly Bulletin, April 2012,
(http://www.rbi.org.in/scripts/BS_ViewBulletin.aspx)
last accessed on 8 Aug 2012
Nagaraj, R (2006): “Indian
Investments Abroad”, Economic & Political Weekly, Vol - XLI No.
46, November 18, 2006
Nayyar, Deepak (2008): “The Internationalization of Firms From India: Investment,
Mergers and Acquisitions”, Oxford
Development Studies, Taylor and Francis Journals, vol. 36(1), pages 111-131
RBI (2010): Balance of
payments manual for India 7 Aug 2012
Notes:
[1] RBI puts out data on outward investment from India
[2] The latest regulations are available in RBI’s “Master
Circular on Direct Investment by Residents in Joint Venture (JV)/ Wholly Owned
Subsidiary (WOS) Abroad, July 02, 2012 ” (http://www.rbi.org.in/scripts/BS_ViewMasCirculardetails.aspx?id=7352),
last accessed on 7 Aug 2012 .
[3] See sections 5.59 to 5.61 and 5.68
of RBI (2010).
[4] See section 6.20 of RBI (2010) - “On
the issue of survey on outward portfolio investments .... transactions of high net-worth individuals
are not being included.” See also the comments at the end of Table 1 in the
article “Indian Investment Abroad
in Joint Ventures and Wholly Owned Subsidiaries: 2009-10 (April-March)” in the RBI monthly bulletin of July 2010.
[5] RBI circular “A.P. (DIR Series)
Circular No.66 dated Jan 13, 2003 ” (http://www.rbi.org.in/scripts/NotificationUser.aspx?Id=1038&Mode=0),
last accessed on 8 Aug 2012
[6] RBI regulation “Foreign Exchange
Management (Transfer or Issue of any Foreign
Security) (Second Amendment) Regulations, 2003” (http://rbi.org.in/Scripts/BS_FemaNotifications.aspx?Id=1300)
last accessed on 8 Aug 2012 .
[7] RBI circular “A.P.
(DIR Series) Circular No. 3 dated July 26, 2006 ” (http://www.rbi.org.in/Scripts/NotificationUser.aspx?Id=3028&Mode=0),
last accessed on 8 Aug 2012
[8] RBI circular “A. P. (DIR Series) Circular No.11 dated Sept 26, 2007 ” (http://www.rbi.org.in/Scripts/NotificationUser.aspx?Id=3833&Mode=0),
last accessed on 8 Aug 2012
[9] RBI Regulation “Foreign Exchange Management (Transfer
or Issue of any Foreign Security) (Third Amendment) Regulations, 2007” (http://rbi.org.in/Scripts/BS_FemaNotifications.aspx?Id=4652)
read along with “Foreign Exchange Management (Transfer or Issue of Any Foreign
Security) (Amendment) Regulations, 2004” (http://rbi.org.in/Scripts/BS_FemaNotifications.aspx?Id=2126)
last accessed on Aug 8 2012
[10] In the latest available regulations (referenced in
note 2), Section B6.1(i) concerning “Portfolio investments by listed Indian
companies” is a subsection of Section
B titled “Direct Investment outside India”
[11] This is in line with the
assertion made by Chalapati Rao and Dhar (2011:111) that regulations for
investing abroad have been primarily designed to “move towards full capital
account convertibility”
[12] The dataset in Khan (2012: Table 1) on outflows in respect of outward
FDI has not been considered in this paper as it does not come with any
explanation of how it can be reconciled with BOP data.
[13] See section 2.3 of RBI (2010) for
the differences between BOP and InIP data.
[14] RBI puts out InIP data in press releases every
quarter. The data up to Mar 2012 is available at (http://www.rbi.org.in/scripts/BS_PressReleaseDisplay.aspx?prid=26761),
last accessed on 8 Aug 2012
[15] BOP statement is included in the Reserve Bank of
India Bulletin issued every month, available at the RBI website
(http://www.rbi.org.in)
[16] Earnings from pre-existing direct investment may be reinvested in the
enterprise or paid out as dividend.
[17] Poor data has been attributed in the past to RBI’s data collection through
a “Survey of India’s Foreign Liabilities and Assets” to which it was not
mandatory for companies to respond. The author is unaware of the current
practice.
[18] Reinvested earnings of FDI in India appear as a credit entry under the ‘foreign
direct investment’ head of the ‘capital account’ of the BOP and as a debit
entry under the ‘investment income’ head of the ‘current account’. Reinvested
do not affect the balance of payments. Indian investment abroad is similarly
treated.
[19] There is some inconsistency in RBI data that could
account in part for the sharp dip. This inconsistency is also seen in RBI’s figure
on investments in joint ventures and subsidiaries (see Table 3) for 2011-12 which
are higher than its BOP figure for the total direct investment outflow.
[20] See “Invisibles in India Mar 10, 2010 available at http://www.rbi.org.in/scripts/BS_ViewBulletin.aspx?Id=11029
last accessed on 27 Sept 2012
[21] This tax concession has been noted by Khan (2012:
para 43)
[22] Data on
Outward Direct Investment is published every month by the RBI and is available
at (http://www.rbi.org.in/scripts/Data_Overseas_Investment.aspx),
last accessed on 8 Aug 2012
[23] In this table, the outward direct investment abroad
is the direct investment in equity and debt in that year and does not include
reinvested earnings or the proceeds of disinvestment.
[28] Calculated from the data in table 4 of Khan (2012)
[29] The reporting requirements are specified in Appendix
A of the ‘master circular’ detailed in note 2
[30] Exhibit 1 in Section E of Khan (2012) explains how
the policy has been ‘relaxed’ in the last few years
[31] See for example
the PTI report “Mauritius July 22, 2012
(http://timesofindia.indiatimes.com/business/india-business/Mauritius-funds-into-Indian-stocks-face-Sebi-RBI-probe/articleshow/15090438.cms)
accessed on Aug
8 2012
[32]
See Deepshikha Sikarwar: “Frame a policy on overseas
investments: RBI to government” Economic Times, Aug
19, 2011 (http://articles.economictimes.indiatimes.com/2011-08-19/news/29905392_1_tax-havens-spvs-direct-taxes-code)
accessed on 8 Aug 2012
Links:
No comments:
Post a Comment